Sample satellite data#
Some graphical tests of current primary functions using the sample satellite data.
import os
import warnings

import cartopy
import cartopy.crs as ccrs
import matplotlib.pyplot as plt
import numpy as np
import pandas as pd
import regionmask
import xarray as xr
from xrframes import Frames

import tams

warnings.filterwarnings("ignore", category=cartopy.io.DownloadWarning)

%matplotlib inline

xr.set_options(display_expand_data=False)
Load data#
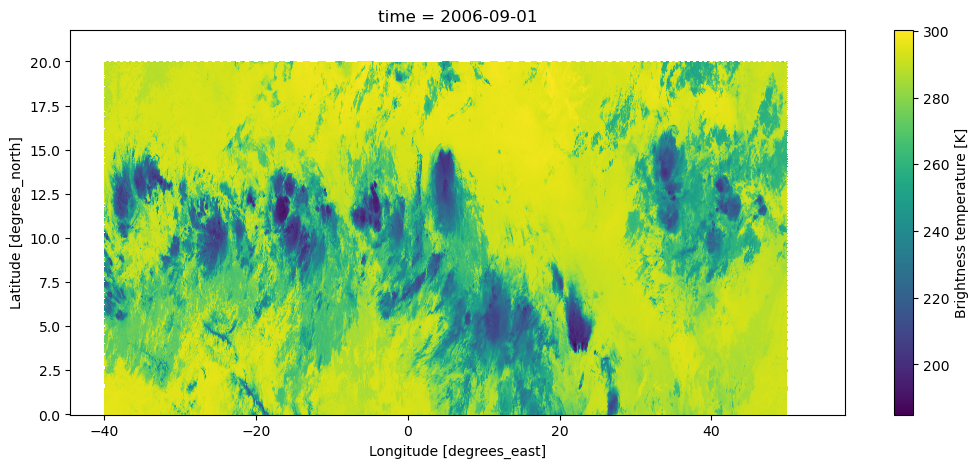
tb = tams.load_example_tb().isel(time=slice(4))
tb
<xarray.DataArray 'ch9' (time: 4, y: 714, x: 2829)> Size: 32MB
295.9 295.9 295.8 295.8 295.8 295.9 295.9 295.8 ... nan nan nan nan nan nan nan
Coordinates:
    lon      (time, y, x) float32 32MB ...
    lat      (time, y, x) float32 32MB ...
  * time     (time) datetime64[ns] 32B 2006-09-01 ... 2006-09-01T06:00:00
Dimensions without coordinates: y, x
Attributes:
    units:      K
long_name: Brightness temperaturetb.isel(time=0).plot(x="lon", y="lat", size=5, aspect=2.5);
Identify cloud elements (CEs)#
times = tb.time
contour_sets, contour_sets_219 = tams.identify(tb)
contour_sets[0].head()
| geometry | area_km2 | inds219 | area219_km2 | cs219 | |
|---|---|---|---|---|---|
| 0 | POLYGON ((43.10657 10.95914, 43.1518 10.96099,... | 75505.811057 | [2, 3, 4, 5, 6] | 29765.307905 | MULTIPOLYGON (((43.11648 11.39076, 43.32919 11... |
| 1 | POLYGON ((35.04399 10.35363, 35.05942 10.35526... | 180394.270027 | [10, 11, 12, 13, 14, 15, 16, 17, 18, 19, 20, 21] | 56096.842040 | MULTIPOLYGON (((35.26395 11.24077, 35.30297 11... |
| 2 | POLYGON ((26.33872 0, 26.89784 0, 27.30282 0.0... | 17858.344651 | [22] | 8989.069746 | MULTIPOLYGON (((26.59017 0.02994, 26.78338 0.0... |
| 3 | POLYGON ((22.11254 3.49762, 23.49709 3.55631, ... | 99926.168432 | [25, 26] | 76675.055415 | MULTIPOLYGON (((22.08261 3.51624, 22.1131 3.51... |
| 4 | POLYGON ((12.96943 2.8417, 13.53301 2.84443, 1... | 378232.478571 | [31, 32, 33, 34, 35, 36, 37, 38, 39, 40, 41, 4... | 109994.951561 | MULTIPOLYGON (((16.02669 5.74587, 16.04421 5.7... |
Note
inds219 gives the indices of 219 (cold-core) shapes in a contour_sets_219 dataframe that are inside a certain 235 shape (row in a contour_sets dataframe).
This is for internal debugging purposes and may be removed in the future.
contour_sets_219[0].head()
| geometry | area_km2 | |
|---|---|---|
| 0 | POLYGON ((46.45179 11.43426, 46.90813 11.48031... | 2861.636356 |
| 1 | POLYGON ((46.41562 12.01331, 46.46724 12.02231... | 1005.761023 |
| 2 | POLYGON ((43.11648 11.39076, 43.32919 11.52867... | 376.874022 |
| 3 | POLYGON ((43.18207 11.2876, 43.22879 11.29522,... | 21270.230923 |
| 4 | POLYGON ((41.55725 11.6926, 41.57923 11.6967, ... | 44.893865 |
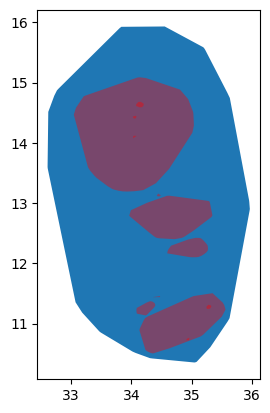
# Simple plot to test 219 matching
m, n = 0, 1  # time, contour #
fig, ax = plt.subplots()
c = contour_sets[m].iloc[[n]]
c.plot(ax=ax)
c.cs219.plot(color="red", ax=ax, alpha=0.4);
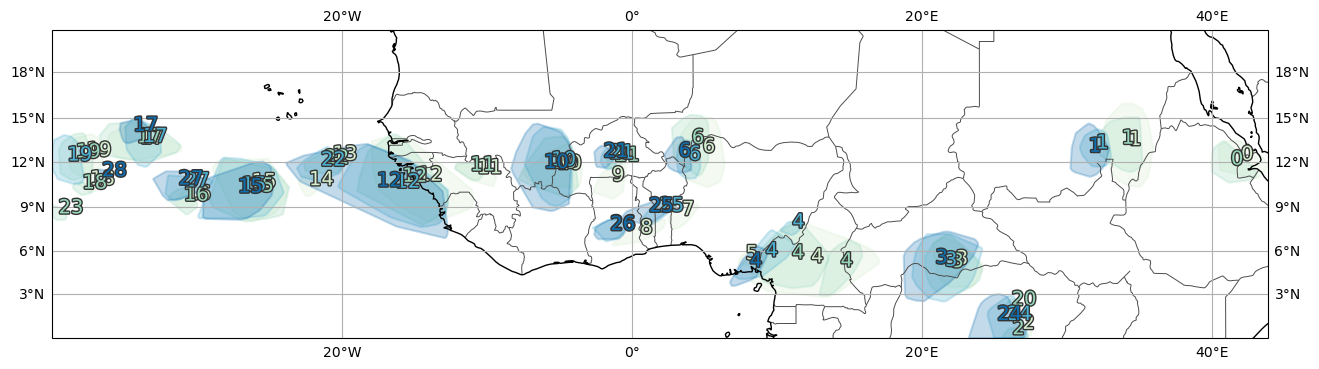
Track CE groups between times#
cs = tams.track(contour_sets, times, u_projection=-5).reset_index(drop=True)
cs.head()
| geometry | area_km2 | inds219 | area219_km2 | cs219 | time | itime | dtime | mcs_id | |
|---|---|---|---|---|---|---|---|---|---|
| 0 | POLYGON ((43.10657 10.95914, 43.1518 10.96099,... | 75505.811057 | [2, 3, 4, 5, 6] | 29765.307905 | MULTIPOLYGON (((43.11648 11.39076, 43.32919 11... | 2006-09-01 | 0 | 0 days 02:00:00 | 0 |
| 1 | POLYGON ((35.04399 10.35363, 35.05942 10.35526... | 180394.270027 | [10, 11, 12, 13, 14, 15, 16, 17, 18, 19, 20, 21] | 56096.842040 | MULTIPOLYGON (((35.26395 11.24077, 35.30297 11... | 2006-09-01 | 0 | 0 days 02:00:00 | 1 |
| 2 | POLYGON ((26.33872 0, 26.89784 0, 27.30282 0.0... | 17858.344651 | [22] | 8989.069746 | MULTIPOLYGON (((26.59017 0.02994, 26.78338 0.0... | 2006-09-01 | 0 | 0 days 02:00:00 | 2 |
| 3 | POLYGON ((22.11254 3.49762, 23.49709 3.55631, ... | 99926.168432 | [25, 26] | 76675.055415 | MULTIPOLYGON (((22.08261 3.51624, 22.1131 3.51... | 2006-09-01 | 0 | 0 days 02:00:00 | 3 |
| 4 | POLYGON ((12.96943 2.8417, 13.53301 2.84443, 1... | 378232.478571 | [31, 32, 33, 34, 35, 36, 37, 38, 39, 40, 41, 4... | 109994.951561 | MULTIPOLYGON (((16.02669 5.74587, 16.04421 5.7... | 2006-09-01 | 0 | 0 days 02:00:00 | 4 |
tams.plot_tracked(cs)
size = 2.5
cx = cy = 3
vmin, vmax = 190, 300

if cx > 1 or cy > 1:
    tb_ = tb.coarsen(x=cx, y=cy, boundary="trim").mean()
else:
    tb_ = tb

x0, x1 = tb_.lon.min().item(), tb_.lon.max().item()
y0, y1 = tb_.lat.min().item(), tb_.lat.max().item()
# extent = [x0, x1, y0, y1]
extent = [-40, 50, 0, 20]

aspect = (x1 - x0) / (y1 - y0)
proj = ccrs.Mercator()
tran = ccrs.PlateCarree()

def plot(tb_i):
    fig = plt.figure(figsize=(size * aspect, size + 1))
    gs = fig.add_gridspec(
        2, 2,
        width_ratios=(1, 1), height_ratios=(aspect * 2 + 1, 1),
        left=0.1, right=0.9, bottom=0.1, top=0.9,
        wspace=0.05, hspace=0.18,
    )

    ax = fig.add_subplot(gs[0, :], projection=proj)
    ax.set_extent(extent, crs=tran)
    ax.gridlines(draw_labels=True)
    ax.coastlines(color="orange", alpha=0.5)

    ax2 = fig.add_subplot(gs[1, 0])
    ax3 = fig.add_subplot(gs[1, 1])

    t = pd.Timestamp(tb_i.time.item())

    # Background -- CTT
    tb_i.plot(
        x="lon", y="lat",
        cmap="gray_r", ax=ax, cbar_ax=ax2,
        transform=tran,
        cbar_kwargs=dict(orientation="horizontal"),
        vmin=vmin, vmax=vmax, extend="both",
    )

    # CEs with colored precip (currently Tb)
    shapes = cs.query("time == @t")[["geometry"]]
    regions = regionmask.from_geopandas(shapes, overlap=False)
    # NOTE: regionmask reports some overlap does exist
    mask = regions.mask(tb_i)
    masked = tb_i.where(mask >= 0)
    masked.plot.pcolormesh(
        x="lon", y="lat",
        ax=ax, cbar_ax=ax3, transform=tran, alpha=0.6,
        cbar_kwargs=dict(orientation="horizontal"),
        vmin=vmin, vmax=vmax, extend="both",
    )

    # Tracks up to this time
    for _, g in cs.groupby("mcs_id"):
        g_ = g[g.time <= t].dissolve("itime")
        c = g_.to_crs("EPSG:32663").centroid.to_crs("EPSG:4326")
        ax.plot(c.x, c.y, ".-", c="r", lw=2, alpha=0.4, transform=tran)
        c_t = c[g_.time == t]
        if not c_t.empty:
            ax.plot(c_t.x, c_t.y, ".", c="r", ms=8, transform=tran)

    ax.set_title("")
    ax.set_title(f"{t:%Y-%m-%d %HZ}", loc="left", size=11)

frames = Frames(tb_, plot, dim="time")
frames.write(dpi=120)
frames.to_gif("./tb.gif", fps=1, magick="READTHEDOCS" not in os.environ)
frames.display()

Classify#
cs = tams.classify(cs)
cs.head()
| geometry | area_km2 | inds219 | area219_km2 | cs219 | time | itime | dtime | mcs_id | mcs_class | |
|---|---|---|---|---|---|---|---|---|---|---|
| 0 | POLYGON ((43.10657 10.95914, 43.1518 10.96099,... | 75505.811057 | [2, 3, 4, 5, 6] | 29765.307905 | MULTIPOLYGON (((43.11648 11.39076, 43.32919 11... | 2006-09-01 | 0 | 0 days 02:00:00 | 0 | DSL |
| 1 | POLYGON ((35.04399 10.35363, 35.05942 10.35526... | 180394.270027 | [10, 11, 12, 13, 14, 15, 16, 17, 18, 19, 20, 21] | 56096.842040 | MULTIPOLYGON (((35.26395 11.24077, 35.30297 11... | 2006-09-01 | 0 | 0 days 02:00:00 | 1 | MCC |
| 2 | POLYGON ((26.33872 0, 26.89784 0, 27.30282 0.0... | 17858.344651 | [22] | 8989.069746 | MULTIPOLYGON (((26.59017 0.02994, 26.78338 0.0... | 2006-09-01 | 0 | 0 days 02:00:00 | 2 | DSL |
| 3 | POLYGON ((22.11254 3.49762, 23.49709 3.55631, ... | 99926.168432 | [25, 26] | 76675.055415 | MULTIPOLYGON (((22.08261 3.51624, 22.1131 3.51... | 2006-09-01 | 0 | 0 days 02:00:00 | 3 | MCC |
| 4 | POLYGON ((12.96943 2.8417, 13.53301 2.84443, 1... | 378232.478571 | [31, 32, 33, 34, 35, 36, 37, 38, 39, 40, 41, 4... | 109994.951561 | MULTIPOLYGON (((16.02669 5.74587, 16.04421 5.7... | 2006-09-01 | 0 | 0 days 02:00:00 | 4 | DLL |