Sample satellite data#
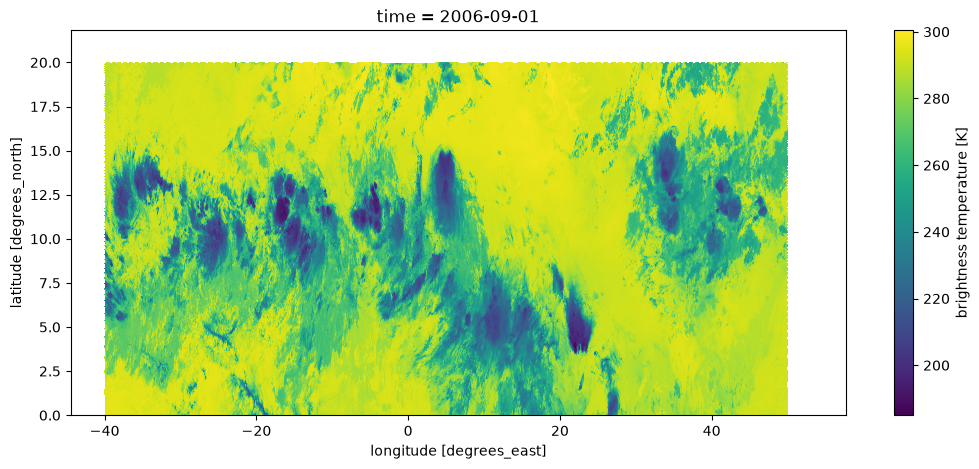
Some graphical tests of current primary functions using the sample satellite data (MSG SEVIRI brightness temperature).
import os
import warnings

import cartopy.io
import cartopy.crs as ccrs
import matplotlib.pyplot as plt
import numpy as np
import pandas as pd
import regionmask
import xarray as xr
from xrframes import Frames

import tams

warnings.filterwarnings("ignore", category=cartopy.io.DownloadWarning)

%matplotlib inline

xr.set_options(display_expand_data=False)
Load data#
tb = tams.data.open_example("msg-tb")["tb"].isel(time=slice(4)).load()
tb
<xarray.DataArray 'tb' (time: 4, y: 714, x: 2829)> Size: 32MB
295.9 295.9 295.8 295.8 295.8 295.9 295.9 295.8 ... nan nan nan nan nan nan nan
Coordinates:
  * time     (time) datetime64[ns] 32B 2006-09-01 ... 2006-09-01T06:00:00
    lon      (time, y, x) float32 32MB -39.98 -39.94 -39.9 ... 57.44 57.52 57.59
    lat      (time, y, x) float32 32MB 0.0 0.0 0.0 0.0 ... 21.78 21.79 21.79
Dimensions without coordinates: y, x
Attributes:
    standard_name:  satellite_geo_meteosat_ir_10.8_radiance
    long_name:      brightness temperature
    units:          K
    valid_min:      0.0
channel: 9tb.isel(time=0).plot(x="lon", y="lat", size=5, aspect=2.5);
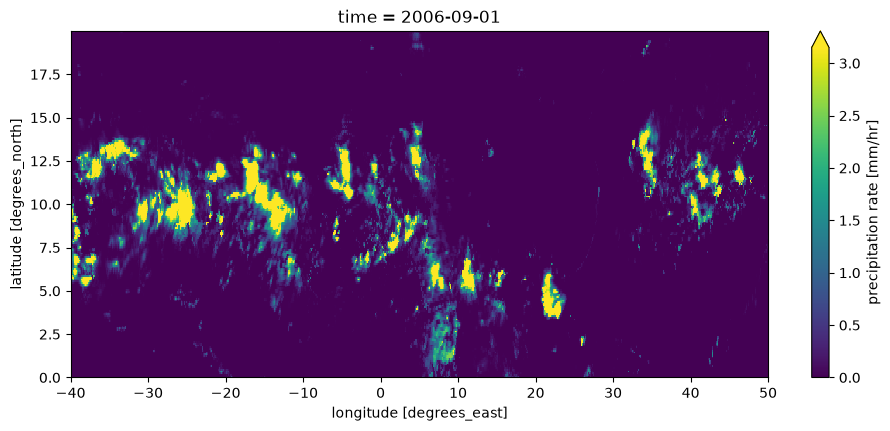
pr = tams.data.open_example("imerg")["pr"].resample(time="2h").mean().load()
pr
<xarray.DataArray 'pr' (time: 6, lat: 200, lon: 900)> Size: 4MB
0.0 0.0 0.0 0.0 0.0 0.0 0.0 0.0 0.0 0.0 ... 0.0 0.0 0.0 0.0 0.0 0.0 0.0 0.0 0.0
Coordinates:
  * time     (time) datetime64[ns] 48B 2006-09-01 ... 2006-09-01T10:00:00
  * lat      (lat) float32 800B 0.05 0.15 0.25 0.35 ... 19.65 19.75 19.85 19.95
  * lon      (lon) float32 4kB -39.95 -39.85 -39.75 -39.65 ... 49.75 49.85 49.95
Attributes:
    units:        mm/hr
    long_name:    precipitation rate
description: Complete merged microwave-infrared (gauge-adjusted) precipi...pr.isel(time=0).plot(size=4.5, aspect=2.5, robust=True);
Identify cloud elements (CEs)#
times = tb.time
ces = tams.identify(tb)
ces[0].head()
| geometry | area_km2 | core | area_core_km2 | |
|---|---|---|---|---|
| 0 | POLYGON ((43.10657 10.95914, 42.40939 11.01821... | 75505.811057 | MULTIPOLYGON (((40.66409 11.52264, 40.65074 11... | 29343.540018 |
| 1 | POLYGON ((35.04399 10.35363, 34.34611 10.42036... | 180394.270027 | MULTIPOLYGON (((34.254 10.54416, 34.23172 10.5... | 55883.296363 |
| 2 | POLYGON ((22.11254 3.49762, 22.05166 3.49982, ... | 99926.168432 | MULTIPOLYGON (((22.05215 3.5163, 21.9614 3.536... | 76675.055415 |
| 3 | POLYGON ((12.96943 2.8417, 9.43767 3.20652, 9.... | 378232.478571 | MULTIPOLYGON (((13.51191 4.2913, 13.53047 4.29... | 109649.300085 |
| 4 | POLYGON ((7.91885 5.02843, 7.39768 5.07655, 7.... | 7420.819872 | POLYGON ((7.86502 5.10828, 7.78258 5.10895, 7.... | 4463.425728 |
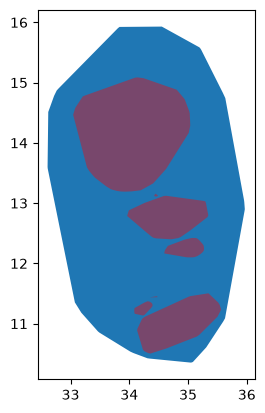
# Simple plot to test 219 matching
m, n = 0, 1  # time, contour #
fig, ax = plt.subplots()
c = ces[m].iloc[[n]]
c.plot(ax=ax)
c.core.plot(color="red", ax=ax, alpha=0.4);
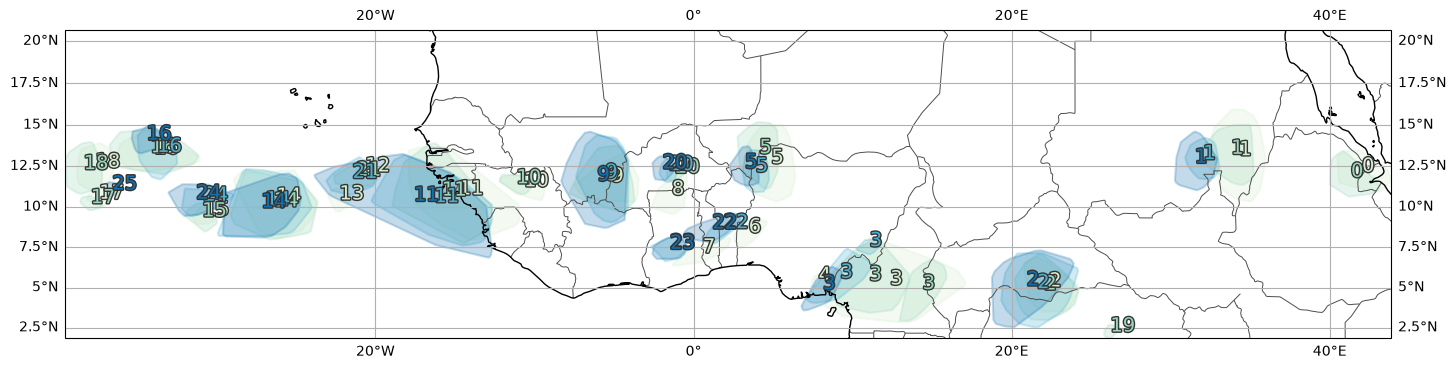
Track CE groups between times#
ce = tams.track(ces, times, u_projection=-5).reset_index(drop=True)
ce.head()
| geometry | area_km2 | core | area_core_km2 | time | itime | dtime | mcs_id | |
|---|---|---|---|---|---|---|---|---|
| 0 | POLYGON ((43.10657 10.95914, 42.40939 11.01821... | 75505.811057 | MULTIPOLYGON (((40.66409 11.52264, 40.65074 11... | 29343.540018 | 2006-09-01 | 0 | 0 days 02:00:00 | 0 |
| 1 | POLYGON ((35.04399 10.35363, 34.34611 10.42036... | 180394.270027 | MULTIPOLYGON (((34.254 10.54416, 34.23172 10.5... | 55883.296363 | 2006-09-01 | 0 | 0 days 02:00:00 | 1 |
| 2 | POLYGON ((22.11254 3.49762, 22.05166 3.49982, ... | 99926.168432 | MULTIPOLYGON (((22.05215 3.5163, 21.9614 3.536... | 76675.055415 | 2006-09-01 | 0 | 0 days 02:00:00 | 2 |
| 3 | POLYGON ((12.96943 2.8417, 9.43767 3.20652, 9.... | 378232.478571 | MULTIPOLYGON (((13.51191 4.2913, 13.53047 4.29... | 109649.300085 | 2006-09-01 | 0 | 0 days 02:00:00 | 3 |
| 4 | POLYGON ((7.91885 5.02843, 7.39768 5.07655, 7.... | 7420.819872 | POLYGON ((7.86502 5.10828, 7.78258 5.10895, 7.... | 4463.425728 | 2006-09-01 | 0 | 0 days 02:00:00 | 4 |
tams.plot_tracked(ce)
size = 2.5
cx = cy = 3
vmin_tb, vmax_tb = 190, 300
vmin_pr, vmax_pr = 0.1, 20

if cx > 1 or cy > 1:
    tb_ = tb.coarsen(x=cx, y=cy, boundary="trim").mean()
else:
    tb_ = tb

extent = [-40, 50, 0, 20]

x0, x1, y0, y1 = extent
aspect = (x1 - x0) / (y1 - y0)
proj = ccrs.Mercator()
tran = ccrs.PlateCarree()

def plot(tb_i):
    fig = plt.figure(figsize=(size * aspect, size + 1))
    gs = fig.add_gridspec(
        2, 2,
        width_ratios=(1, 1), height_ratios=(aspect * 2 + 1, 1),
        left=0.005, right=0.995, bottom=0.14, top=0.87,
        wspace=0.05, hspace=0.18,
    )

    ax = fig.add_subplot(gs[0, :], projection=proj)
    ax.set_extent(extent, crs=tran)
    ax.gridlines(draw_labels=True)
    ax.coastlines(color="orange", alpha=0.5)

    ax2 = fig.add_subplot(gs[1, 0])
    ax3 = fig.add_subplot(gs[1, 1])

    t = pd.Timestamp(tb_i.time.item())

    # Background -- CTT
    tb_i.plot(
        x="lon", y="lat",
        cmap="gray_r", ax=ax, cbar_ax=ax2,
        transform=tran,
        cbar_kwargs=dict(orientation="horizontal"),
        vmin=vmin_tb, vmax=vmax_tb, extend="both",
    )

    # CEs with colored precip
    pr_i = pr.sel(time=t)
    shapes = ce.query("time == @t")[["geometry"]]
    shapes.plot(ax=ax, fc="none", ec="purple", transform=tran)
    regions = regionmask.from_geopandas(shapes, overlap=False)
    # NOTE: regionmask reports some overlap does exist
    mask = regions.mask(pr_i)
    masked = pr_i.where((mask >= 0) & (pr_i >= vmin_pr))
    masked.plot.pcolormesh(
        x="lon", y="lat",
        ax=ax, cbar_ax=ax3, transform=tran, alpha=0.6,
        cbar_kwargs=dict(orientation="horizontal"),
        vmin=vmin_pr, vmax=vmax_pr, extend="both",
    )

    # Tracks up to this time
    for _, g in ce.groupby("mcs_id"):
        g_ = g[g.time <= t].dissolve("itime")
        c = g_.to_crs("EPSG:32663").centroid.to_crs("EPSG:4326")
        ax.plot(c.x, c.y, ".-", c="r", lw=2, alpha=0.4, transform=tran)
        c_t = c[g_.time == t]
        if not c_t.empty:
            ax.plot(c_t.x, c_t.y, ".", c="r", ms=8, transform=tran)

    ax.set_title("")
    ax.set_title(f"{t:%Y-%m-%d %HZ}", loc="left", size=11)

frames = Frames(tb_, plot, dim="time")
frames.write(dpi=120, savefig_kws=dict(bbox_inches=None))
frames.to_gif("./tb.gif", fps=1, magick="READTHEDOCS" not in os.environ)
frames.display()
Classify#
ce = tams.classify(ce)
ce.head()
| geometry | area_km2 | core | area_core_km2 | time | itime | dtime | mcs_id | mcs_class | |
|---|---|---|---|---|---|---|---|---|---|
| 0 | POLYGON ((43.10657 10.95914, 42.40939 11.01821... | 75505.811057 | MULTIPOLYGON (((40.66409 11.52264, 40.65074 11... | 29343.540018 | 2006-09-01 | 0 | 0 days 02:00:00 | 0 | DSL |
| 1 | POLYGON ((35.04399 10.35363, 34.34611 10.42036... | 180394.270027 | MULTIPOLYGON (((34.254 10.54416, 34.23172 10.5... | 55883.296363 | 2006-09-01 | 0 | 0 days 02:00:00 | 1 | MCC |
| 2 | POLYGON ((22.11254 3.49762, 22.05166 3.49982, ... | 99926.168432 | MULTIPOLYGON (((22.05215 3.5163, 21.9614 3.536... | 76675.055415 | 2006-09-01 | 0 | 0 days 02:00:00 | 2 | MCC |
| 3 | POLYGON ((12.96943 2.8417, 9.43767 3.20652, 9.... | 378232.478571 | MULTIPOLYGON (((13.51191 4.2913, 13.53047 4.29... | 109649.300085 | 2006-09-01 | 0 | 0 days 02:00:00 | 3 | DLL |
| 4 | POLYGON ((7.91885 5.02843, 7.39768 5.07655, 7.... | 7420.819872 | POLYGON ((7.86502 5.10828, 7.78258 5.10895, 7.... | 4463.425728 | 2006-09-01 | 0 | 0 days 02:00:00 | 4 | DSL |